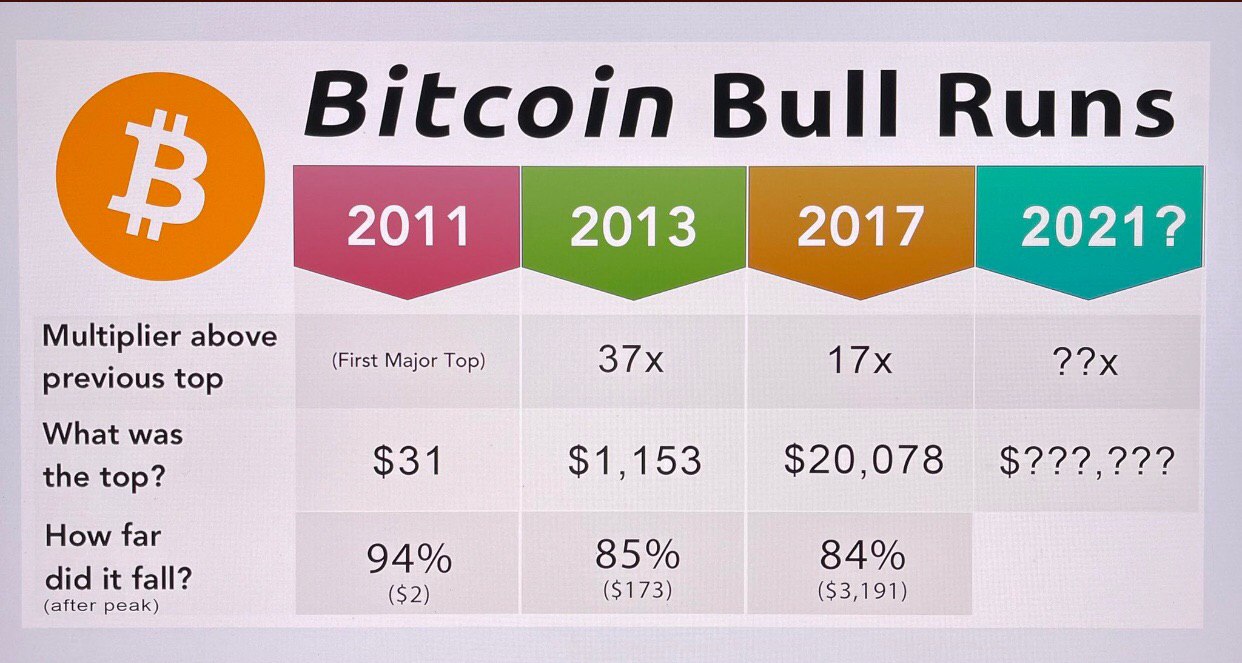
While digital currency markets have increased significantly in value a number of crypto asset proponents are wondering how far the next bull run will take them. For instance, the last three bitcoin bull runs saw different price spikes and significant drops below 80% as well. If the next bitcoin bull run follows a similar pattern, it’s quite possible the crypto-asset could reach $160k per unit.
At the time of publication, the cryptocurrency economy is well above a half of a trillion dollars and is hovering at $538 billion today. The great 2020 crypto price boom has a number of crypto proponents wholeheartedly believing the bitcoin bull run is now in session.
At a price height of around $18,977 per coin, bitcoin (BTC) has come awfully close to reaching the 2017 all-time high. A myriad of individuals think that bitcoin could quite easily reach six digits in value crossing over the $100k zone in the future.
For instance, in a recent interview, Bloomberg Intelligence’s senior commodity strategist Mike McGlone discussed bitcoin sustaining current levels. During the report, McGlone said within the next 1-2 years there’s a possibility BTC could add another zero to the tail end of the price tag.
A great number of bitcoiners also believe BTC could reach $100k or more and discussions about this price range are commonplace on Twitter and Reddit forums. For example, the Youtuber Colin Talks Crypto tweeted about the patterns of bitcoin bull runs on Sunday.

The chart Colin shared shows that BTC had three prior bullish price periods in 2011, 2013, and of course 2017. In 2011, bitcoin (BTC) skyrocketed for the first time ever to $31 per coin but subsequently dropped 94% in value.
Then during the economic fiasco in Cyprus and the heyday of the exchange Mt Gox, BTC spiked 37x to $1,153 per coin according to Colin’s chart. The following bear market dive saw an 85% loss over the following two years in 2014 and 2015. In 2017, BTC saw the largest bull run price yet, touching $20,078 per coin on a few global exchanges on December 17.
After the bitcoin bull run of 2017, Colin’s chart shows BTC took an 84% dive to a low of $3,191 per unit. The rest of his chart shows a bunch of question marks because the future outcome has yet to come to fruition.
“This chart shows historically that peak to peak bitcoin has been 37x [and] 17x,” Colin said in his tweet. “Even if we assume the pattern continues & a decrease in multiplier occurs, it’s fair to expect an 8x increase from previous ATH. $20,000 x 8 = $160,000 per BTC,” the Youtuber added.
Colin further added that he thinks “$160k per bitcoin is a very conservative estimate.” “Likewise, I consider it a ridiculous estimate to assume BTC would only go to $50k, for example. $50k would only be a 2.5x from The previous ATH. BTC bull runs have never even been close to that small before,” he pointed out.
Now if BTC touched a top at $160 by jumping 8x the previous all-time high, the possibility of a huge dump pattern could also follow. If one was to assume a conservative drop in value at around 84% after topping at $160k, BTC’s price would end up bottoming out at around $25,600 per coin.
Of course, we have no idea if BTC will follow a similar path or an assumed pattern and BTC’s price could very well follow an opposite trajectory. Moreover, BTC haters like Peter Schiff think that eventually, bitcoin will be worthless.
“The idea that bitcoin’s value comes from the past work required to validate the information encoded on the [blockchain] is nonsense. If I work hard to dig a hole and then fill it back up with dirt, what value does my labor create? Effort that produces no value is worthless,” Schiff tweeted on Friday.
What do you think about the possibility of bitcoin reaching $160k in the future? Let us know what you think about this subject in the comments section below.
The post Previous Bitcoin Bull Run Patterns Suggest Current Run Could See a $160K Top, Possible $25K Bottom appeared first on Bitcoin News.
via Jamie Redman
0 comments:
Post a Comment